-
인기글
#30 'Language charts 언어 사용 분포' (Table)
IELTS Writing Task 1: Sample writing #30
(아이엘츠 라이팅 테스크 1 : #30 'language charts' (Table))
작성자 : BIG JANE(맘잉글리쉬 mom-eng.com)
참조 : ielts-simon.com
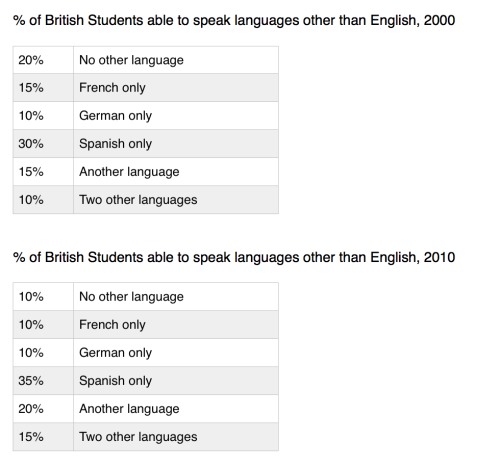
The charts below show the proportions of British students at one university in England who were able to speak other languages in addition to English, in 2000 and 2010.

The tables compare the percentages of British university students who spoke different languages in addition to English in two separate years.
It is noticeable that in both years, 2000 and 2010, the majority of British students at the university in question were able to speak at least one other language. We can also see an increase in the proportion of second and third language speakers over the 10-year period.
In the year 2000, 80% of the students were able to speak one or two foreign languages, and 20% only spoke English. Ten years later, there was a rise of 5% in the proportion of those who spoke a second language. There was also an increase, from 10% to 15%, in the proportion of students who were able to speak two foreign languages.
Looking at the specific second languages spoken, in 2000, 30% of the students were able to speak Spanish, 15% spoke French, and 10% spoke German. By 2010, the proportion of Spanish speakers had risen to 35%, there were 5% fewer French speakers, and the figure for German speakers remained at one in ten. Finally, we can see that the percentage of speakers of other second languages, apart from Spanish, French and German, rose from 15% to 20% over the period shown.
추천인 25


