


-
.svg) Popular
Popular
#17 BAR CHART
IELTS Writing Task 1: Sample writing #17
(아이엘츠 라이팅 테스크 1 : #17 BAR CHART)
작성자 : BIG JANE(맘잉글리쉬 mom-eng.com)
참조 : ielts-simon.com
이번 에세이에서 "incidents and injuries"가 반복적으로 사용되었지만, 이 단어들은 적정한 동의어가 없기 때문에 걱정할 필요가 없습니다. 가장 중요한 것은 그래프 상의 데이타를 명확하게 표현하고 비교하는 것입니다.
The chart below shows numbers of incidents and injuries per 100 million passenger miles travelled (PMT) by transportation type in 2002.
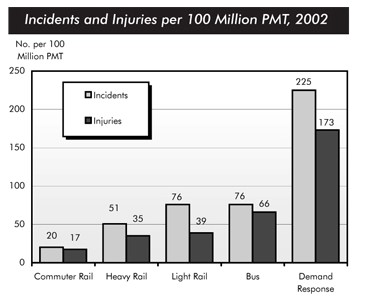
The bar chart compares the number of incidents and injuries for every 100 million passenger miles travelled on five different types of public transport in 2002.
It is clear that the most incidents and injuries took place on demand-response vehicles. By contrast, commuter rail services recorded by far the lowest figures.
A total of 225 incidents and 173 injuries, per 100 million passenger miles travelled, took place on demand-response transport services. These figures were nearly three times as high as those for the second highest category, bus services. There were 76 incidents and 66 people were injured on buses.
Rail services experienced fewer problems. The number of incidents on light rail trains equalled the figure recorded for buses, but there were significantly fewer injuries, at only 39. Heavy rail services saw lower numbers of such events than light rail services, but commuter rail passengers were even less likely to experience problems. In fact, only 20 incidents and 17 injuries occurred on commuter trains.
(165 words, band 9)
추천인 20
-

hyunjong91 -

yun4701 -

라퐁 -

superior123 -

RnMA


good.