


-
.svg) 인기글
인기글
#23 LINE GRAPH
IELTS Writing Task 1: Sample writing #23
(아이엘츠 라이팅 테스크 1 : #23 LINE GRAPH)
작성자 : BIG JANE(맘잉글리쉬 mom-eng.com)
참조 : ielts-simon.com
The graph below shows the average number of UK commuters travelling each day by car, bus or train between 1970 and 2030.
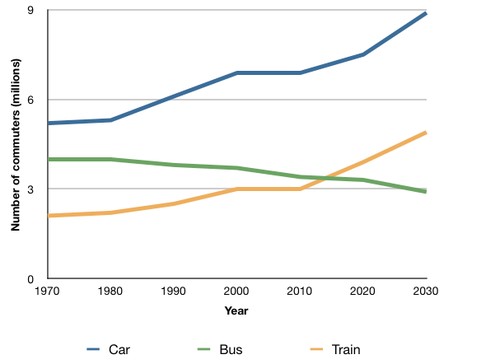
The line graph compares figures for daily travel by workers in the UK using three different forms of transport over a period of 60 years.
It is clear that the car is by far the most popular means of transport for UK commuters throughout the period shown. Also, while the numbers of people who use the car and train increase gradually, the number of bus users falls steadily.
In 1970, around 5 million UK commuters travelled by car on a daily basis, while the bus and train were used by about 4 million and 2 million people respectively. In the year 2000, the number of those driving to work rose to 7 million and the number of commuting rail passengers reached 3 million. However, there was a small drop of approximately 0.5 million in the number of bus users.
By 2030, the number of people who commute by car is expected to reach almost 9 million, and the number of train users is also predicted to rise, to nearly 5 million. By contrast, buses are predicted to become a less popular choice, with only 3 million daily users.
추천인 25
-

eunsae -

yun4701 -

superior123 -

RnMA -
허수아비


