


-
.svg) 인기글
인기글
#19 BAR + LINE CHART
IELTS Writing Task 1: Sample writing #19
(아이엘츠 라이팅 테스크 1 : #19 BAR + LINE CHART)
작성자 : BIG JANE(맘잉글리쉬 mom-eng.com)
참조 : ielts-simon.com
The chart compares average figures for temperature and precipitation over the course of a calendar year in Kolkata.
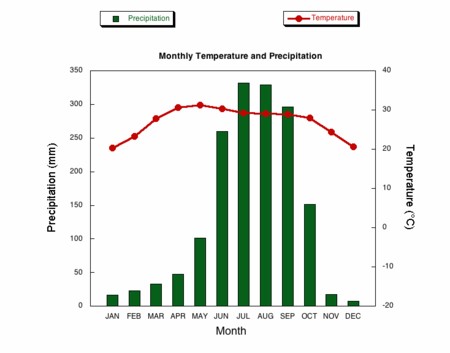
It is noticeable that monthly figures for precipitation in Kolkata vary considerably, whereas monthly temperatures remain relatively stable. Rainfall is highest from July to August, while temperatures are highest in April and May.
Between the months of January and May, average temperatures in Kolkata rise from their lowest point at around 20°C to a peak of just over 30°C. Average rainfall in the city also rises over the same period, from approximately 20mm of rain in January to 100mm in May.
While temperatures stay roughly the same for the next four months, the amount of rainfall more than doubles between May and June. Figures for precipitation remain above 250mm from June to September, peaking at around 330mm in July. The final three months of the year see a dramatic fall in precipitation, to a low of about 10mm in December, and a steady drop in temperatures back to the January average.
(173 words, band 9)
추천인 24
-

Louis -

superior123 -

RnMA -
허수아비


