-
인기글
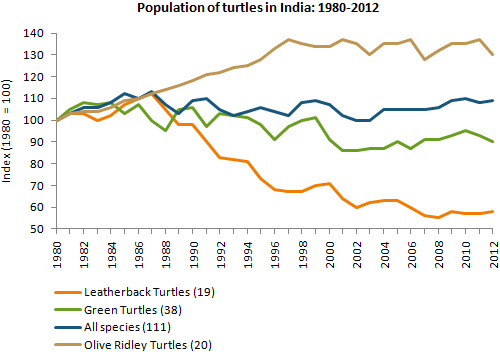
#34 인도의 거북이 종류별 개체 수 (Line Graph)
IELTS Writing Task 2: Sample writing #34
아이엘츠 라이팅 테스크 1 모범답안
The graph below shows the population figures of different types of turtles in India between 1980 and 2012.
Summarise the information by selecting and reporting the main features, and make comparisons where relevant.

The line graph illustrates the changes in the turtle population in India in the time period 1980-2012. Specifically, three types of turtles are described, namely: Leatherback Turtles (19), Green Back Turtles (38), Olive Ridley Turtles (20) as well as all species combined (111). Numbers are reported relative to the 1980 population size of each group.
Overall, the turtle population in India remained relatively constant over the time period when all species are considered. Olive Ridley turtles increased the most while Leatherback turtles showed the biggest decline between 1980 and 2012.
From 1980 to 1982, numbers for all species showed a slight increase of up to 10%, but then levelled off again around the 100% mark with slight fluctuations.
However, individual turtle species showed considerable variations over time. Two turtle populations, the Leatherback and Green Turtles, declined between 1990 and 2012 after remaining relatively stable initially. While the Green Turtle decreased only slightly, finishing at 90% in 2012, the numbers of Leatherback Turtles plummeted to less than 60% of the 1980 population size over the same time period.
In contrast, the number of Olive Ridley Turtles showed an overall increase. There was a steady rise up to 1997, after which this turtle population plateaued around 130% with minor fluctuations.
추천인 7


