-
인기글
#32 'Table'
IELTS Writing Task 1: Sample writing #32
(아이엘츠 라이팅 테스크 1 : #32 'Table')
작성자 : BIG JANE(맘잉글리쉬 mom-eng.com)
참조 : ielts-simon.com
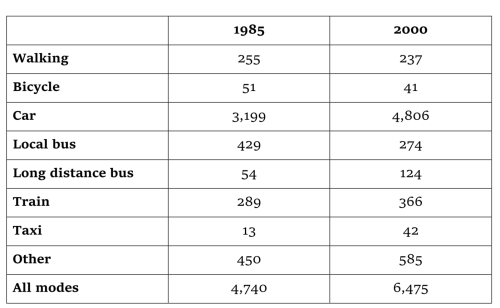
The table below gives information about changes in modes of travel in England between 1985 and 2000.
Average distance in miles travelled per person per year, by mode of travel

The chart shows average distances that people in England travelled using different forms of transport in the years 1985 and 2000.
It is clear that the total number of miles travelled by English people using all modes of transport increased significantly between 1985 and 2000. The car was by far the most used form of transport in both years.
In 1985, the average person travelled 3,199 miles by car, and this rose to 4,806 miles in the year 2000. The figures for miles travelled by train, long distance bus, taxi and other modes also increased from 1985 to 2000. Travel by taxi saw the most significant change, with more than a threefold increase from 13 miles per person per year in 1985 to 42 miles in 2000.
There was a fall in the average distances for three forms of transport, namely walking, bicycle and local bus. In 1985, English people walked an average of 255 miles, but this figure fell by 18 miles in 2000. Bicycle use fell from 51 to 41 miles over the period shown, while the biggest downward change was in the use of local buses, with average miles per person falling from 429 to 274 over the 15-year period.
추천인 42


